


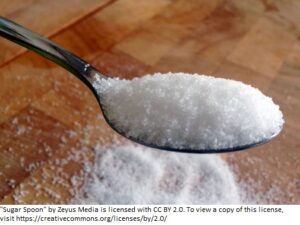


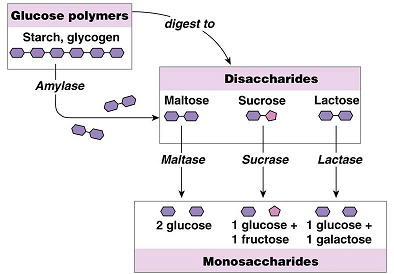
Sugar for energy
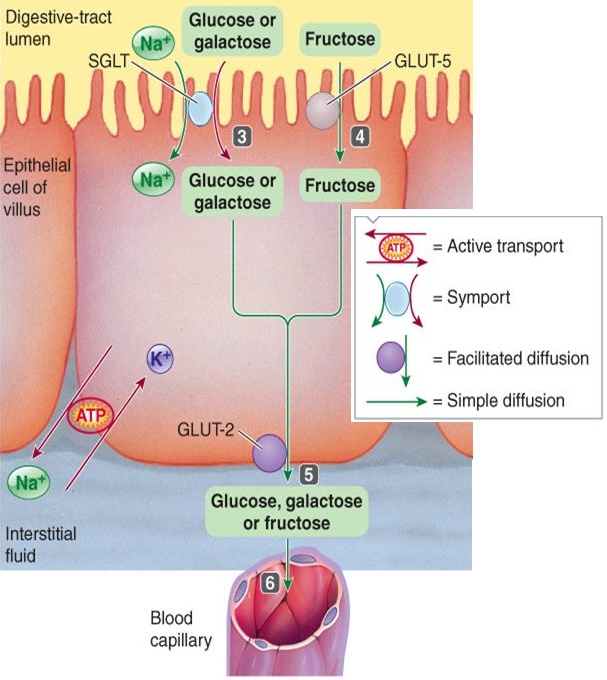
Glucose. Metabolized mainly through cellular respiration inside cells, it is vital for producing ATP (adenosine triphosphate) energy that powers muscle movement, nerve signals, and various cell functions. The brain has an especially high need for glucose, not only for energy but also for production of fat, protein and DNA. Blood glucose levels are therefore tightly controlled by the pancreatic hormones insulin and glucagon:
- Insulin – helps cells absorb glucose
- Glucagon – raises blood sugar by releasing stored glucose (glycogen) from the liver as needed.
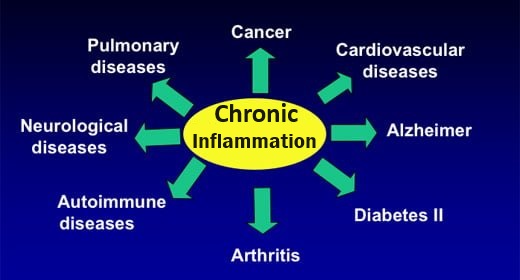
Fructose. Metabolism occurs mostly in the liver, where it can be converted into glucose or stored as glycogen, or 25% is converted into lactate and sent to the bloodstream, where it can supply energy to muscles. Unlike glucose, fructose does not stimulate insulin release or raise blood sugar and its conversion to glucose is not regulated by a feedback mechanism, and if glycogen stores are full, excess fructose is used for both lactate and fat production in the liver, setting the stage for non-alcoholic fatty liver disease (NAFLD) and high triglycerides. Additionally, lactate production has uric acid as a by-product, which in excess can trigger inflammation.
- Excess fructose consumption leads to metabolic syndrome. It increases your insulin levels (hyperinsulinemia), not by direct stimulation of the pancreas, but as a consequence of insulin resistance (IR). As the body’s cells become insensitive to insulin, the pancreas is forced to produce more insulin, which leads to chronic hyperinsulinemia, type 2 diabetes and communication breakdown between the hunger hormone leptin and your brain’s hypothalamus, preventing you from feeling satisfied after eating, and prompting you to eat more – which translates to weight gain and blood sugar issues.
- High levels of fructose are consumed in sweeteners such as high fructose corn syrup added to many beverages and products.
Galactose. Uses a different metabolic process to glucose. Galactose compels the mitochondria (the cell’s power plants) to use fat and oxygen to produce glucose for energy. This conversion is an inefficent way to produce energy, but is useful on a ketogenic diet since it encourages the body to burn fat. Also, galactose provides an even supply of energy to cells, without spikes or dips in blood sugar – benefitting those with high blood sugar.
Glucose. In a fed state liver cells take up about 30-40% of glucose. In a fasting state, most glucose (body’s main fuel source) is transported in the blood to peripheral tissues, where ideally, INSULIN enables it to be taken up by peripheral cells to produce energy. Glucose blood basal levels are maintained at about 4-5 mmol/L, since the brain requires a constant supply. Surplus glucose is first stored as glycogen in (a) the liver (holds about 3 ½oz) — used to maintain basal blood glucose level, and (b) in the muscles (about a pound) —- to be used for movement. Any extra glucose is going into long-term storage as fat! – hence the need to control the amount of incoming sugars and carbs if you don’t want to “pay” for storage 
Too much sugar makes you fat
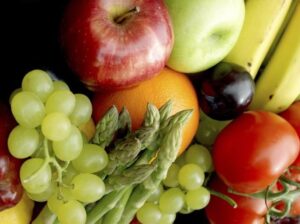
Fructose. Eaten in moderate quantities, most fructose is taken up by the liver and converted to glucose, glycogen and lactate. A fraction is converted into fatty acids and uric acid. A small amount ends up in the bloodstream. However, the American diet typically includes excessive amounts of fructose consumption, usually from added sweeteners such as high fructose corn syrup, which can lead to metabolic syndrome – including non-alcoholc fatty liver disease, hyperinsulinemia, high triglycerides, high blood sugar, type 2 diabetes and weight gain.
Too much fructose wreaks havoc with your health
Galactose. Taken up by liver cells (hepatocytes) and primarily converted into glucose and stored as glycogen.
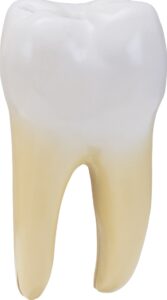
All nutritive sugars can be harmful to teeth and cause health problems if consumed to excess. They should therefore be used in moderation.
Cane sugar is preferable to beet sugar. Over 98% of beet sugar grown in N. America is now GMO.
Calculations in chart
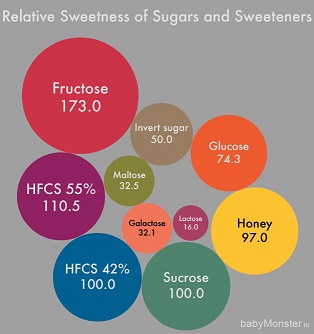
This chart enables you to compare sugars based on their glycemic index (GI) / glycemic load (GL) and how many calories are consumed compared to 1 metric teaspoon of table sugar (sucrose)to obtain the equivalent amout of sweetness. (Table sugar has 15 calories and a Sweetness Index (SI) of 1)
- Equivalent calories to equal 1 metric tsp. of sucrose sweetness is calculated as:
Cals./ tsp. (i.e. g/tsp * cals / g) divided by Food’s sweetness index (SI)
E.g. Equiv. cals for honey = 7.1 g/tsp. * 3 cals /g divided by .94 = 21.3 cals / tsp divided by .94 = 23
- Equivalent # of teaspoons to equal 1 tsp. of sucrose sweetness is calculated as:
Equiv. cals. to equal sweetness of 1 tsp sucrose divided by Cals. / tsp
E.g. Equiv. # of tsps. of honey = 23 equiv. cals. divided by 21.3 cals / tsp. = 1 “good” tsp. 
- Glycemic Load (GL) is calculated as:
Food’s GI * Grams of carbohydrates / serving size divided by 100
E.g. GL of sucrose = 65 * 4g / 100 = 2.6
“Sugars” in last column gives the percentage of total sugars in the specific sweetener, not including moisture content.
| Sweetness Index |
|---|
Sucrose is the standard to which all other sweeteners are compared. How is SI determined? The simplest method uses the discrimination method , which asks the tester to choose the sweetest between two samples (2-alternative forced choice or 2-AFC). This has not unexpectedly yielded different results from different test sources. The following chart lists the average findings. Humans can recognize sweetness in about 1 or 2% sucrose solution. Coffee is typically sweetened to about the level of 5% sucrose. Soft drinks are usually about as sweet as 10% sucrose. |
| Calories and teaspoons |
|---|
There are 4.02 grams (nutrition facts generally round this down to 4 g / tsp.) in 1 U.S. / metric teaspoon (5cc or 5 ml) of granulated table sugar. BTW – the Brits’ definition of a teaspoon is whatever comes out of the cutlery drawer to stir their tea 🙂 A web search reveals varying figures for amounts of calories in sugar comparisons. This is mainly because (1) people have different ideas on teaspoon size, (2) do not account for different densities of sugars (which determines calories / teaspoon), and (3) also round off numbers. Here, the calculations are specified. The “Calorie” mentioned on a food package is actually a kilocalorie, or 1,000 calories. A Calorie (really kcal) is the amount of energy needed to raise the temperature of 1 kilogram of water 1 degree Celsius. |
CHART of some NATURAL Nutritive Sweeteners | ||||||||
|---|---|---|---|---|---|---|---|---|
| SWEETENER | Equiv cals. to = 1 tsp. of sucrose sweetness | g/ tsp | Cal /g | Sweetness Index (SI): Sucrose = 1 | Glyc. Index (GI) | Glyc. Load (GL) | Notes | Sugars / Production |
| Sucrose (Table sugar) (Domino’s granulated; demerara brown) | 15 cals (1 tsp. or 5cc) | 4 | 3.75 | 1 | 65 +/-4 | 2.6 | In honey, maple syrup, fruit, veg; Used in candies, desserts | Glycosidic/covalent bond links glucose and fructose molecules 50% glucose / 50% fructose; from sugar cane or beet (almost all GMO); |
| Confectioners sugar | 16 cals | 2.54 | 3.99 | Used in candies, cakes etc. | ||||
| Glucose (Dextrose; Grape sugar) | 18 cals ( ~1 1/3 tsp) | 4 | 3.33 3.8 | 0.74 | 100 | 5.2 | Adds sweetness and texture to food; Used in hospital drips, vit C prod. | Monosaccharide; C6H12O6 ; Body’s main fuel; |
| Fructose (fruit sugar) | 10 cals (~2/3 tsp) | 4 | 3.66 | 1.5 | 19 | 0.5 | In fruit/veg, HFCS; used in relatively minor amounts; | Monosaccharide; Digested differently to other sugars (excessive intake linked to several health problems); mostly From modified corn starch; |
| Galactose | 38 cals (2 1/4 tsp) | 4 | 4.2 | 0.44 0.3 .35 .6 .4-.6 | 25 | In milk and dairy | Monosaccharide; | |
| Lactose (milk sugar) | 88 cals | 4 | 4.2 | 0.19 0.15 .2 .16 .2-.3 | 45 | In milk (but almost none in butter, cheese and yogurt) | Disaccharide; (glycosidic bond: glucose+galactose) | |
| Maltose | 56 (1/3 tsp) | 4 | 4.2 | 0.3 .3-.5 .5 .32 .3-.4 | 105 | In beer; used in bread-making; sold as syrup; | Disaccharide; glycosidic bond: (glucose+glucose) from germinated barley; | |
| Trehalose (glucose+glucose) | 37 cals (~ 1/2 tsp) | 4 | 4.2 | 0.45 | 70 | In mushrooms, honey, bread, beer, wine, 20% in shiitake mushrooms and baker’s yeast; cocoon of the beetle Trehala manna (likely source of manna in OT); | ||
| Dehydrated/Evaporated natural sugar cane juice | 16 cals (1 tsp) | 4 | 1 | 43 | Rapidura®;Sucanat® (contraction of sugar cane natural); burnt caramel taste; | Unrefined, crystallized cane sugar; | ||
| Muscovado Sugar | Moist; strong molasses flavor | Unrefined cane sugar w/ high molasses content | ||||||
| Turbinado sugar | Light caramel flavor | from 1st pressing of sugar cane, retains some molasses; | ||||||
| Brown sugar | Brown sugar is refined white sugar w/ molasses added back in; | |||||||
| Demerara sugar | Crunchy grains; Toffee flavor | Boiled /dehydrated first-pressed sugar cane juice; retains some molasses | ||||||
| Coconut sugar | ||||||||
| SWEETENER | Equiv cals. to =1 tsp. of sugar’s sweetness | g/ tsp | Cal /g | Sweetness Index (SI): Glucose = 1 | Glyc. Index (GI) | Glyc. Load (GL) | Notes | Sugars / Production |
Raw Honey – “Natural antibiotic” | 23 cals (~1 tsp) ( 7.1g/tsp * 3 cals/g =21.3 cals/tsp then ÷ .94 = 23) Equiv. tsp. is 23 ÷ 21.3 | 7.1 | 3 | .94 | 55 +/-3 | 4 | Natural sugar; Produced by bees from nectar; sugars: 43% glucose / 49% fructose /5% disaccharides (sucrose, maltose, isomaltose, maltulose, turanose and kojibiose) | |
| Maple syrup | 13 cals (1 tsp) | 5 | 2.6 | 1 0.6 | 54 | Natural sugar; boiled/evaporated maple sap; ~ 50% glucose /50% fructose | ||
| Blackstrap Molasses | 17 cals (1 1/4 tsp) | 7.1 | 2 | 0.85 | 55 | Sugar extract | ||
| Barley malt syrup | 40.6 (2 tsp) | 7.1 | 2.86 3.2 | 0.5 | 45 42 | Sugar extract; germinated barley; | ||
| Turbinado cane sugar | Natural sugar | |||||||
| Date sugar | 4.56 | 3.3 | Natural sugar | |||||
| Golden syrup | 1.1 | 60 | Tate and Lyles Golden Syrup | 49% fructose/49% glucose/10% other | ||||
| Invert sugar | 50 | Used in food industry; soft centers of candies, marzipan, liqueurs; helps preserves foods; prevents crystallization /drying out; | Made from sucrose; draws water; 45% glucose /45% fructose (unbound) /10% other; | |||||
Chart of Highly-refined / MODIFIED sugar (Enzyme-converted starch)Nutritive sweeteners | ||||||||
|---|---|---|---|---|---|---|---|---|
| SWEETENER | Equiv cals to =1 tsp. of sugar’s sweetness | g / tsp | Cal / g | Sweetness Index (SI): Glucose = 1 | Glyc. Index (GI) | Glyc. Load (GL) | Found /Used in | Sugars / Production |
| High fructose corn syrup | 1 | Made from corn starch | ||||||
| HFCS-42 42% fructose | 27 | 6.75 | 4 | 1 | 58 | Beverages, processed foods, cereals, baked goods | 42% fructose / 52% glucose | |
| HFCS-55 55% fructose | 24 | 6.75 | 4 | 1.1 | 68 | soft drinks | 55% fructose / 41% glucose | |
| Corn syrup /glucose syrup | 30-40 | 100 | Glucose + oligoglucose (short chains of glucose) | |||||
| Corn syrup solids | 23-40 | 100 | Dehydrated corn syrup | |||||
| Agave syrup / nectar | 13.5 (1/2+ tsp) | 7.1 | 2.86 | 1.5 | 12.5 | Up to 92% fructose; highly refined | ||
| Brown rice syrup | 32 | 4 2.6 | 0.5 | 25-98 | Enzymes used to breakdown starch in cooked brown rice; metabolizes to 100% glucose | |||
| Maltodextrin | 6-21 | 100 | Additive in processed foods | Longer glucose chains than corn syrup; Made from corn, potato starch, rice, wheat | ||||


