Glycemic index (GI) vs. Glycemic Load (GL)
Glycemic Index (GI)
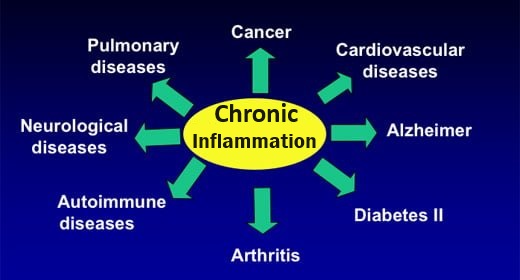
Higher blood sugar levels spur increased INSULIN levels in order to mobilize excess blood glucose into fat storage
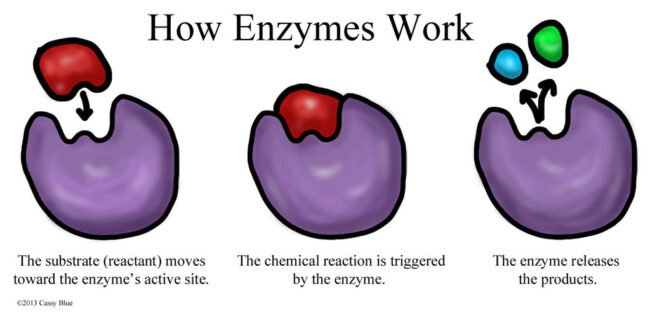
The glycemic index (GI) of a food refers to how quickly that food releases its glucose and raises blood sugar levels when it is consumed. Developed in 1981 by David Jenkins at the U. of Toronto, the GI is specifically a comparative ranking of the effect that 50 grams of a given food has on blood sugar.
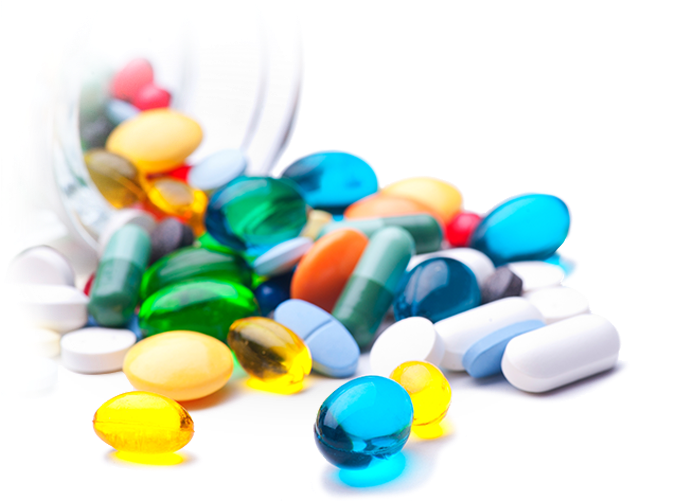
Knowing a food’s GI is particularly helpful if you are diabetic and want to control blood sugar levels and swings, or to a long-distance runner who would favor high glycemic foods. Normal blood glucose level is 68 to 135 mg/dL. Blood sugar too low may cause fainting or a coma, too high can cause damage to body organs, particularly the kidneys and eyes.
The GI for a food is a number relative to the GI of glucose, which is 100. Fasting blood sugar levels regularly over 126 mg/dl (hyperglycemia) or A1C test result of >6.5% (an average measure of blood sugar over 2-3 months) show a higher risk of developing glucotoxicity. Note that high blood sugar is not necessarily related to diabetes — evidence suggests that it can also result from oxidative stress damage to pancreatic, INSULIN-producing beta cells, due to such as stress, poor diet or lack of exercise.
The glycemic index for a food depends on:
- The amount of carbohydrate present.
- The type of carbohydrate present.
- The presence of other substances (e.g. soluble fiber) that slow down carbohydrate metabolism.
| Glycemic Index (GI) Values | ||
|---|---|---|
| Low | Medium | High |
| 1-55 | 56-69 | 70+ |
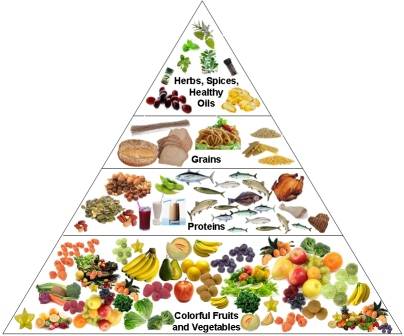
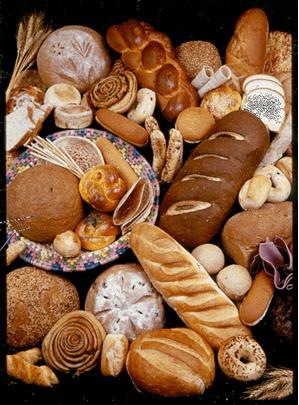
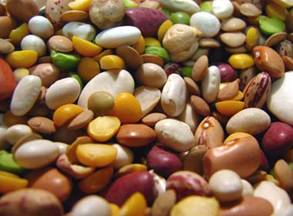
Generally — less-processed, fiber-rich foods such as non-starchy vegetables (e.g. asparagus, artichoke, baby corn, beets, bamboo shoots, brussels sprouts, broccoli, cabbage, carrots, cauliflower, celery, cucumber, eggplant, leeks, mushrooms, pea pods, peppers, onions, radishes, rutabaga, salad greens, sprouts, swiss chard, turnips, tomato, water chestnuts), beans and whole grains have a lower GI than sugary or highly-processed foods such as sodas and white bread.

Glycemic Load (GL)
The GL is a more realistically accurate comparable unit than the GI because it takes serving size into account (the GI is based on consumption of 50g). E.g. 1/3 Cup watermelon weighs~ 50 g, but typical serving size is 1 cup, three times as much.
The Glycemic Load (GL) is calculated as:
Food’s GI * (Grams of carbohydrates / serving size) / 100
| Glycemic Index (GI) and Glycemic Load (GL) Values | |||
|---|---|---|---|
| Low | Medium | High | |
| GI | 1-55 | 56-69 | 70+ |
| GL | 1-10 | 11-19 | 20+ |
| Chart of foods comparing GI to GL | ||||
|---|---|---|---|---|
| HIGH CARB FOODS | ||||
| Food | GI | GL | Carbs (g)/serving | |
| Glucose, maltodextrin | 1 tsp (9g) | 100 | 9 | 9 |
| Corn syrup | 1 Tbsp (30g) | 90 | 27 | 30 |
| Doughnut | 1 | 76 (high) | 17 | |
| White bread | Slice (30g) | 75 ±2 | 10 | 14 |
| Whole wheat bread | Slice (30g) | 74 ±2 | 10 | 14 |
| Specialty seed/grain bread | Slice (41g) | 53 ±2 | 7 | 14 |
| Ryvita | Slice (10g) | 65 | 4 | 6 |
| White spaghetti (boiled 15 mins) | 1 Cup | 44 | 18 | 43 |
| Whole grain spaghetti | 1 Cup | 48 ±2 | 16 | 37 |
| White rice, boiled | 1/2 Cup | 73 ±4 | 17 | 21 |
| White basmati rice, boiled | 1/2 Cup | 50 | 13 | 25 |
| Brown rice, boiled | 1/2 Cup | 55 | 15 | 23 |
| Brown basmati rice, boiled | 1/2 Cup | 45 | 11 | 25 |
| Rolled oats (porridge) |
1/2 Cup (45g) |
59 | 19 | 33 |
|
Quaker Instant apple & cinnamon oatmeal |
1 pkt (43g) |
83 | 27 | 33 |
| Pearled barley | 1/2 Cup | 28 ±2 | 7 | 22 |
| Couscous | ~1 Cup (150g) | 65 ±4 | 9 | |
| Quinoa | 0.8 Cup (150g) | 53 | 13 | |
| Cornflakes | 1.5 Cup (42g) | 80 | 29 | 36 |
| FRUIT | ||||
| Food | GI | GL | Carbs /serving (g) | |
| Apple | Med. | 36 ±2 | 6 | 18 |
| Pear | Med. | 38 | 4 | 22 |
| Peach | Med. | 56 | 7 | 12 |
| Banana | Small | 51 ±3 | 11 | 20 |
| Mango | 51 ±3 | |||
| Raspberries | 1/2 Cup | 25 | 1 | 3.5 |
| Blueberries | 1/2 Cup | 2.5 | 9 | 20 |
| Dates | 42 ±4 | |||
| Orange | Med. | 43 ±3 | 5 | 13 |
| Blueberries | 1/2 Cup | 2.5 | 9 | 20 |
| Grapefruit | 1/2 large | 25 | 2.75 | 11 |
| Watermelon | 1 cup cubed (150g) | 76 ±4 | 8 (low) | 11 |
| Raisins | 1/4 Cup | 64 | 17 | 26 |
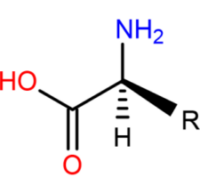
| PROTEIN-RICH FOODS | ||||
| Food | GI | GL | Carbs /serving (g) | |
| Almonds | 1 oz | 1.5 | – | 3 |
| Walnuts | 1oz | 15 | 1 | 2 |
| Bacon | 3 strips | 0 | – | 0 |
| Eggs, poached | 1 large | 0 | – | 1 |
| Beef steak | 3 oz | 0 | – | 0 |
| Cheddar cheese | 1.5 oz | 0 | – | 1 |
| VEGETABLES | ||||
| Food | GI | GL | Carbs /serving (g) | |
| Potato, boiled | 1/2 Cup | 78 ±4 | 11 | 14 |
| Potato chips | 4 oz | 54 | 30 | 55 |
| Carrots, steamed | 1/2 Cup chopped | 39 ±4 | 1 | 4 |
| Sweet potatoes | 1/2 C mashed | 63 ±6 | 15 | 25 |
| Peas, cooked | 1/2 Cup | 51(low) | 5.6 (low) | 11 |
| Avocado (very low sugar content) | 1/2 med. | near 0 | 0 | 4 |
| CANDIES / SUGAR | ||||
| Food | GI | GL | Carbs /serving (g) | |
| White table sugar (2 tsp) | 65 ±4 | 7 | ||
| Snickers candy bar | 2 oz | 58 | 21 | 34.5 |
| Jelly beans (10 large) | 78 | 22 | ||
| Honey | 1 Tbsp | 55 | 9 | 17 |
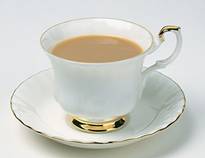
| DRINKS | ||||
| Food | GI | GL | Carbs /serving (g) | |
| Beer, Budweiser 4.9% alc. | 12 oz | 66 | 7 | 11 |
| Gin, 40% alc. | 1 oz | 0 | 0 | 0 |
| White wine | 5 oz | 0 | 0 | 4 |
| Coca Cola | 8 oz | 53 | 13 | 25 |
| Orange juice | 6 oz | 53 | 11 | 20 |
“-” no data